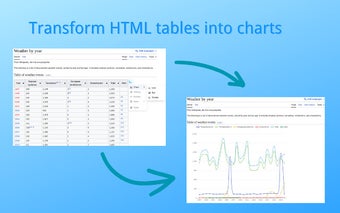
Transform HTML Tables into Stunning Charts with Chart Immerse
Chart Immerse is a powerful Chrome extension that seamlessly converts HTML tables from any website into visually stunning and interactive charts. With just a few clicks, you can transform your tabular data into line graphs, bar charts, scatter plots, and mixed charts, allowing you to explore and present your data in a whole new way.
Chart Immerse offers a user-friendly interface that makes chart creation and customization intuitive and accessible to users of all levels. You can easily customize chart titles, axis labels, chart size, and other settings to tailor your visualizations to suit your needs. The extension also provides shareable chart links, allowing you to effortlessly collaborate, present, and showcase your insights to others.
In addition, Chart Immerse allows you to export your charts as high-quality PNG or JPG images, making it convenient to use them in presentations, reports, or any other medium you prefer. The extension offers a freemium model, with the core features available for free. For advanced capabilities and enhanced customization options, a premium upgrade is available.
With Chart Immerse, you can unlock the potential of your data and create impactful visualizations that captivate your audience.